The Reports and Dashboards feature is designed to help your association keep tabs on predictions along with gauging patterns and trends.
Using the Report and Dashboard feature
You will have access to a report that will display the risk lapse categories and list the members of each category in the order of their lapse risk. You can use this to drive your membership campaign and track renewals
The Dashboard provides a summary of five member-lapse risk categories that range from Low Risk to Critical Risk
In addition to the provided reports and dashboards, you can create your own to provide additional insight such as renewal rates based on lapse categories and the break down of lapse categories within each membership type.
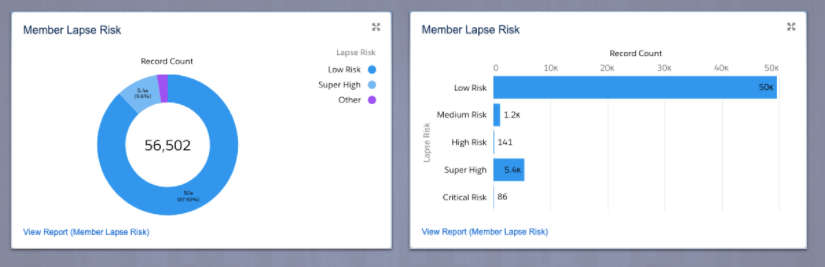
Figure 1. Dashboard example screenshot